Minnesota Cancer Reporting System (MCRS)
Related Sites
Contact Info
Minnesota Breast Cancer Screening: Data, Disparities, and Social Determinants
Mobile phone users, turn phone sideways for best viewing.
On this page:
Early detection and treatment
New cancers (incidence)
Deaths (mortality)
Census tract level
Social determinants of health
Sage breast cancer screening and resources
Early detection and treatment of breast cancer
The primary goal of breast cancer screening is early detection and timely treatment. Early-stage breast cancers are typically smaller and less likely to have spread beyond the breast, leading to better outcomes. In Minnesota, the five-year survival rate for breast cancers diagnosed at the site in the body where they started (local stage) is 99% compared to just 36% for cancers that have spread to distant sites in the body (distant stage).
While early diagnosis and treatment are important, other factors contribute to health disparities and inequities in breast cancer outcomes. Social determinants of health such as access to transportation, health insurance coverage, and the cost of health care can create significant barriers to breast cancer screening and treatment for certain populations.
Addressing these social determinants of health is essential for developing breast cancer screening programs, interventions, and policies that target populations most in need of improved outcomes. This interactive dashboard presents Minnesota screening data that showcases how selected social determinants of health impact both measures of breast cancer burden (incidence and mortality) and breast cancer screening rates. This tool is designed to support program planning, decision making, and resource allocation. The resource section at the end of this page includes links to additional data sources, as well as background information on social determinants of health.
How to use these data
This dashboard allows you to view different data indicators. Visit MCRS: Cancer Technical Notes to learn more about data definitions and how to interpret the data. Specific instructions on how to interpret each chart are included below.
Rates of new breast cancers (incidence) | Minnesota 2018-2022
By poverty indicator, race, region, and stage at diagnosis
The chart below provides new breast cancer incidence rates overall and by early or late stage at diagnosis. Rates can be broken down by poverty level and demographic characteristics including race and State Community Health Services Advisory Committee regions (SCHSAC regions).
Start by selecting a demographic indicator then select a cancer stage to generate a chart of incidence rates for your selection.
Rates of breast cancers deaths (mortality) | Minnesota 2018-2022
By race and region
The chart below provides rates of breast cancer mortality by demographic characteristics including race and SCHSAC region. Select race or SCHSAC region to generate a chart of mortality rates for your selection.
Rates of breast cancer (incidence) by census tracts, poverty indicator, and region | Minnesota 2013-2022
The map below provides census tract level breast cancer incidence by poverty level and region (SCHSAC region and county).
Start by selecting a map region, then select a poverty level to generate a map showing census tract level incidence rates for your selection. Click on the map to filter the table or on the table to filter the map. Download the Sage site table in the Sage section below.
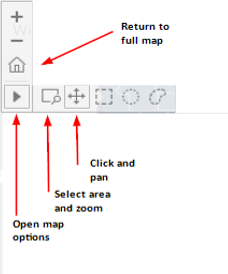
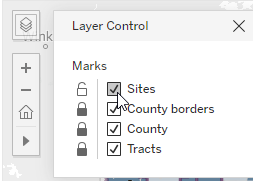
Map controls
 | Map (below) navigation (hover in left upper corner for options)-Home button (full state map), triangle (open map options), magnifier (select and zoom in), cross (click and pan) |
 | Layer control (hover in left upper corner for options). Check/uncheck boxes to toggle layers on/off |
Breast cancer screening rates by social determinants of health | Behavioral Risk Factor Surveillance System (BRFSS) 2020 – 2022
The chart below provides breast cancer screening rates by social determinants of health. Select a category and a BRFSS question to generate a chart showing breast cancer screening rates by the BRFSS question you selected. Note that chart may be blank until category and variable are selected.
The percentages on the charts are the percent of women who reported getting a mammogram. For example, interpreting the numbers in the charts for Education Level, we would conclude that: Among women over 40 that answered "College 4 years or more (College graduate)" to the question about their "EDUCATION", 71% reported having a mammogram in the last two years.
Minnesota Department of Health Sage Screening Program
The Sage Screening Programs helps low-income Minnesotans or those who do not have adequate insurance to access breast and cervical cancer screening, diagnostic services (if screening tests are abnormal), and referral to treatment services.
Visit About Sage to learn more about the program.
Other sources of cancer statistics and additional resources
For reports on cancer in Minnesota, visit MCRS Cancer Statistics and Reports.
For Minnesota Cancer Reporting System data and queries visit Minnesota Public Health Data Access portal.
For cancer statistics in the US, including Minnesota visit:
- National Cancer Institute-Cancer Statistics
- National Cancer Institute-State Cancer Profiles
- National Program of Cancer Registries
- Centers for Disease and Prevention online database-CDC WONDER
- United States Cancer Statistics: Data Visualizations
- Regional Profiles - MN Department of Health
- State Health Compare
- MN Community Measures
For more information on social determinants of health and cancer disparities:
- Healthy People 2030 - Social Determinants of Health
- Cancer Disparities - National Cancer Institute
- Breast Cancer Early Detection and Diagnosis - American Cancer Society